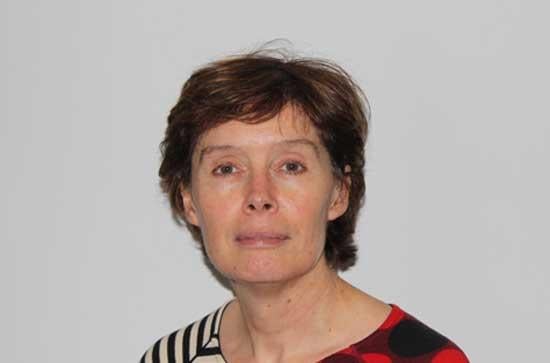
Catherine HurleyView profile
Professor
Catherine Hurley is a Professor of Statistics at Maynooth University's Faculty of Science & Engineering, where she serves as Subject Head of Statistics in the Department of Mathematics and Statistics. She maintains strong affiliations with both the MU Hamilton Institute and the National Centre for Geocomputation, positioning her work at the intersection of statistics, data science, and computational methods. Dr. Hurley is a leading expert in data visualization with primary research interests in visualization techniques for data science and machine learning problems. Over her distinguished career, she has authored and contributed to numerous software packages, beginning with Data Viewer (1987), a predecessor to GGobi, Quail (1987-2000), and many R packages including condvis2, vivid (2021), and Bartvis (2022). Her work has significantly advanced the field of statistical graphics and model visualization. Her recent research has focused on conditional visualization for statistical models, with several publications on the condvis package and related tools that enable researchers to explore complex machine learning models through interactive visual interfaces. She has also made substantial contributions to dendrogram seriation, pairwise comparison visualization, and variable importance displays, creating numerous R packages that have become essential tools for statisticians and data scientists. Her 2023 publications include significant contributions to Bayesian additive regression trees and variable importance visualization for machine learning models. Dr. Hurley has held significant leadership roles in the statistical community, serving as Vice-President (2017-2019) and President (2019-2021) of the Irish Statistical Association. She also served as Editor-in-Chief and Editor of the R Journal from 2019 to 2023, playing a crucial role in advancing open-source statistical software development and dissemination. Her work demonstrates a consistent pattern of developing practical visualization tools that address real-world challenges in statistical analysis and machine learning interpretation. The progression from early work on statistical graphics infrastructure to recent innovations in model exploration reflects her sustained commitment to making complex statistical concepts accessible through visualization.